
How Can Time Series Analysis Benefit From Multiple Modalities? A Survey and Outlook - Part 2
Contents
- Abstract
- Introduction
- Background and Taxonomy
- Taxonomy
- Background
- TimeAsX: Resuing Foundation Models of Other Modalities for Efficient TSA
- Time As Text
- Time As Image
- Time As Other Modalities
- Domain-Specific TS Works
3. TimeAsX: Resuing Foundation Models of Other Modalities for Efficient TSA
(2) Time As Image
Quite natural! Similar to how humans perceive patterns!
a) Line-graphs
- Most popular way to convert TS2image
- To use vision foundational models (e.g., ViT)
- E.g., VLMs for anomaly detection [200, 237] and classification [37].
- Examples) [137, 218, 200, 237, 37]
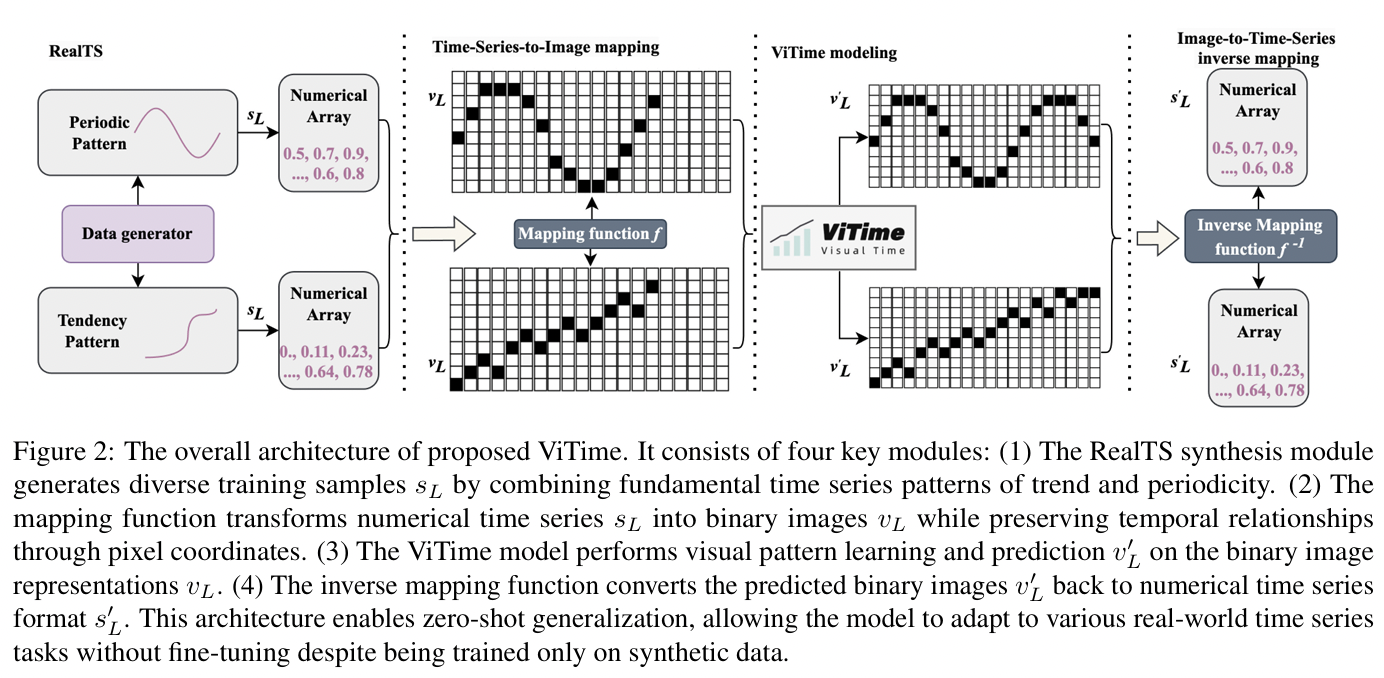
- [137] ViTime: A Visual Intelligence-Based Foundation Model for Time Series Forecasting https://www.arxiv.org/pdf/2407.07311v3
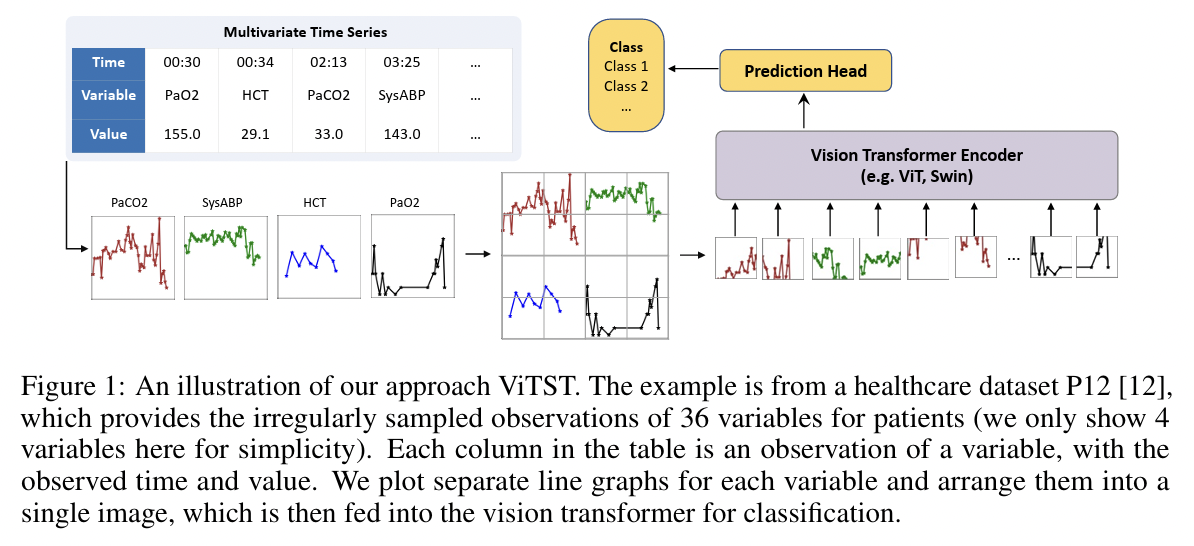
- [218] Time Series as Images: Vision TransformerforIrregularly Sampled Time Series https://www.arxiv.org/pdf/2303.12799
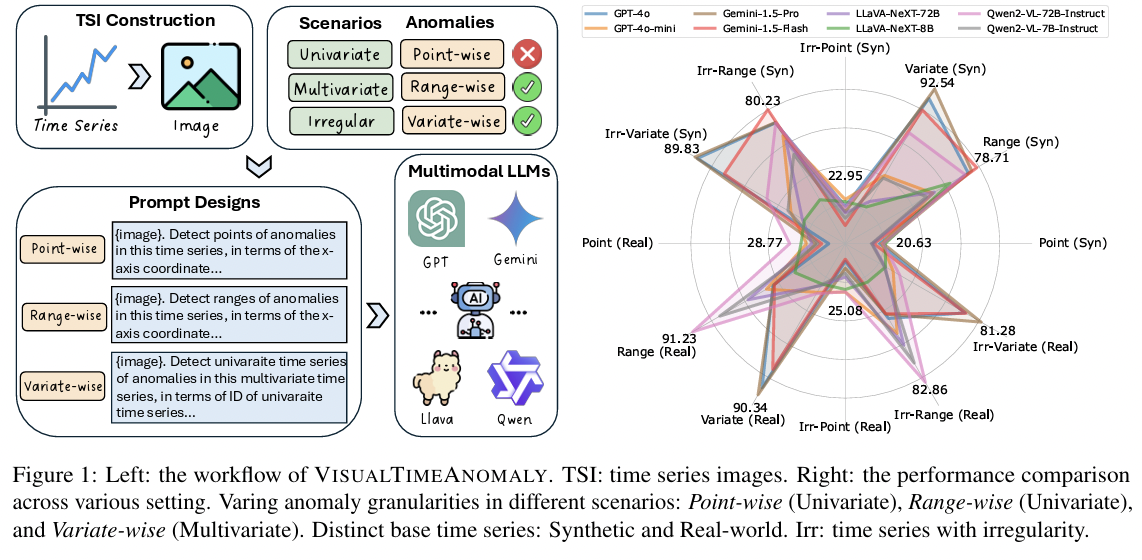
- [200] Can Multimodal LLMs Perform Time Series Anomaly Detection? https://www.arxiv.org/pdf/2502.17812
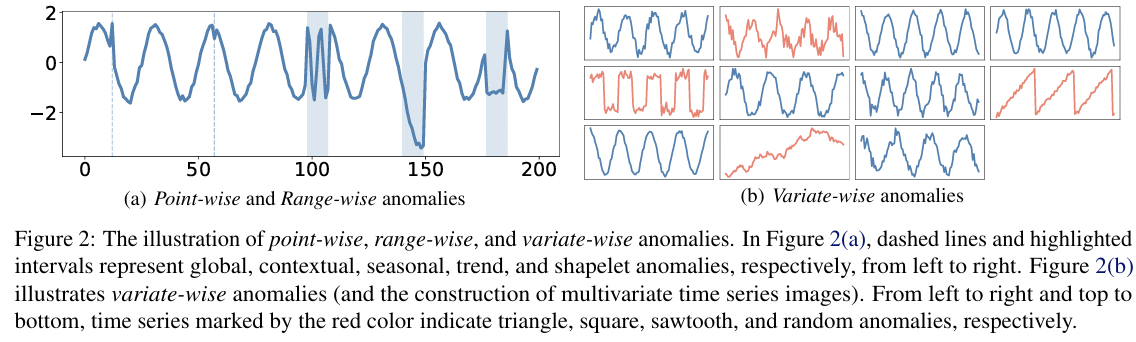
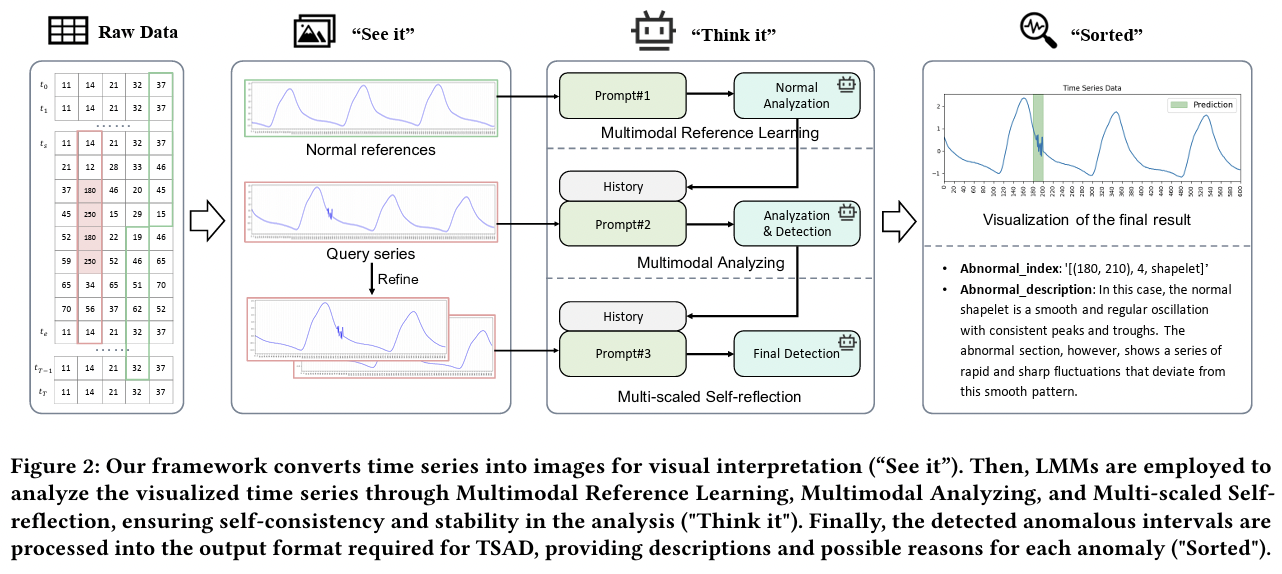
- [237] See it, Think it, Sorted: Large Multimodal Models are Fewshot Time Series Anomaly Analyzers. https://www.arxiv.org/pdf/2411.02465
- [37] Plots Unlock Time-Series Understanding in Multimodal Models. https://www.arxiv.org/pdf/2410.02637
ViTime
ViTST
VisualTimeAnomaly
TAMA (Time Series Anomaly Multimodal Analyzer)
b) Heatmaps
- Visualize TS in a 2D space
- Colors = Represent magnitudes
- Specifically useful for modeling LONG TS
- Examples) [143,219]
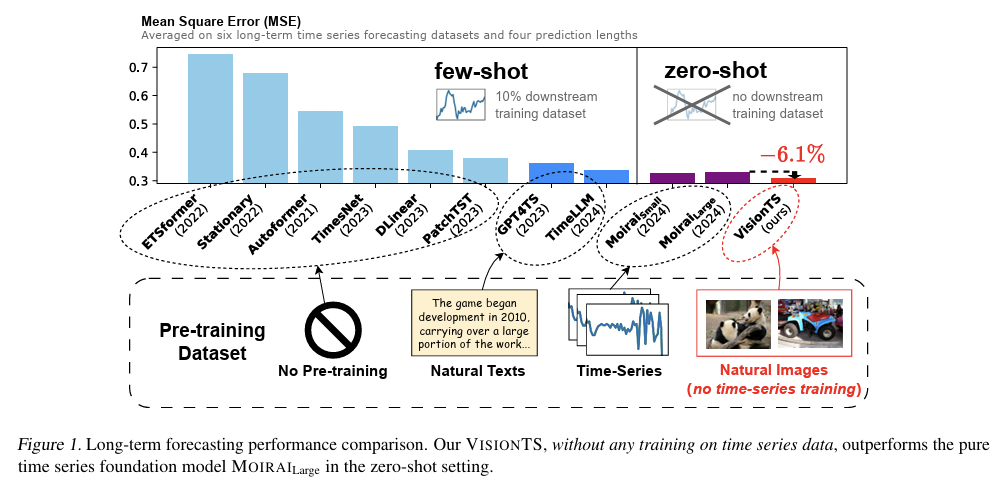
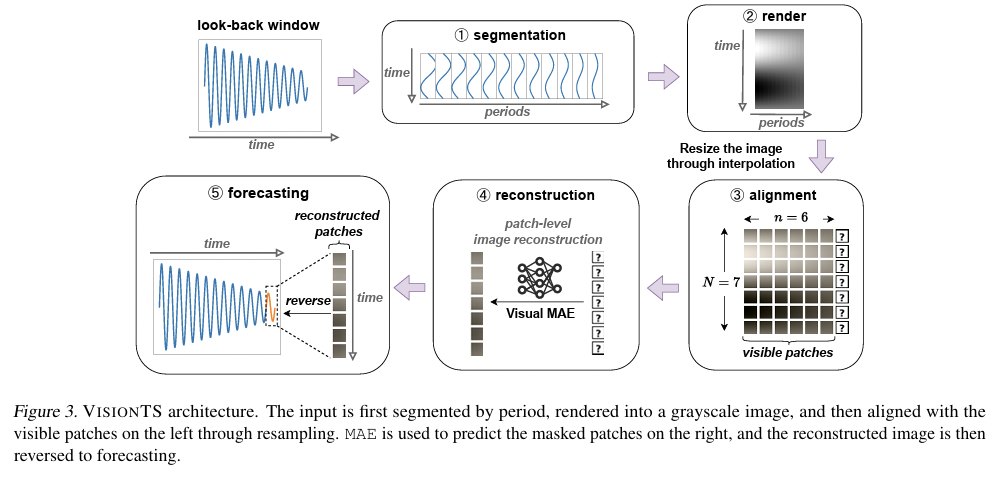
- [143] VisionTS: Visual Masked Autoencoders Are Free-Lunch Zero-Shot Time Series Forecasters https://www.arxiv.org/pdf/2408.17253
- [219] Deep video prediction for timeseries forecasting
VisionTS
c) Spectrogram
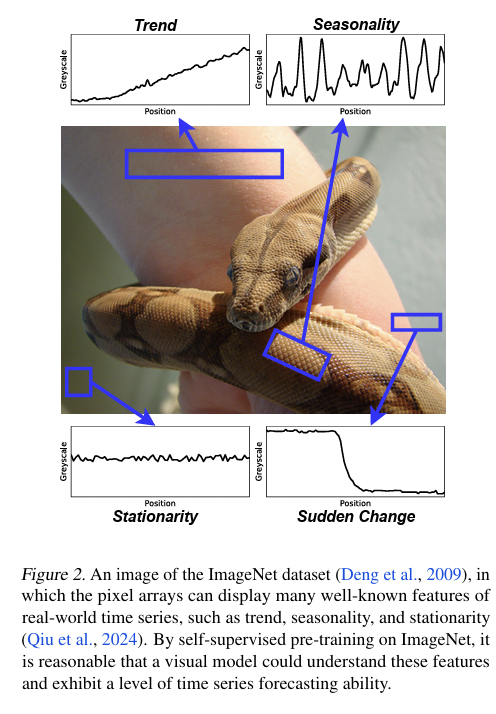
Time series can be decomposed into the spectrum of frequencies and represented as a spectrogram. Wavelet transforms are a popular choice of representation for both univariate [220] and multivariate [144] tasks.
d) Other methods
Zhiguang and Tim [231] use Gramian Angular Fields (GAF) [20] to represent time-series. which visualize long and short termdependenciesbetter.Recurrenceplots(RP)Eckmannetal. [47] areanotherwaytocaptureperiodicpatternsintime-seriesused by [89] for classification and [110] forecasting. Time-VLM [161] combines information from Fourier coefficients, cosine and sine periodicity into a heatmap which is fed into a VLM encoder.