
MASTER: Market-Guided Stock Transformer for Stock Price Forecasting
(https://arxiv.org/pdf/2312.15235)
Contents
- Introduction
Abstract
“Stock price” forecasting
-
Recent efforts: Modeling complex stock correlations
-
Existing works:
- Step 1) Learns “temporal” patterns from “individual” stock series (with common arch)
- Step 2) “Mixes up” temporal representations to establish “stock correlations”
$\rightarrow$ Limitation: Only consider time-aligned stock correlations
Two limitations
- (1) Stock correlations often occur momentarily and in a cross-time manner
- (2) Feature effectiveness is dynamic with market variation
MASTER (MArkert-Guided Stock TransformER)
-
(1) Models the “momentary” and “cross-time” stock correlation
-
How? Alternatively engaging in …
- a) intra-stock
- b) inter-stock
information aggregation.
-
-
(2) Leverages market information for “automatic feature selection”
1. Introduction
a) Stock price forecasting
Dynamics in the stock price series are intricate!
$\rightarrow$ The mixing of factors interweaves the stock market as a correlated network!
Previous works
-
[Line 1] Relied on “predefined” concepts, relationships, or rules
& Established a “static” correlation graph
- e.g., Stocks in the same industry are connected
$\rightarrow$ Do not account for the real-time correlation of stocks!
-
[Line 2] “Attention mechanism” to compute dynamic stock correlations
- More flexible and applicable to the time-varying stock sets
- Generally follow a common “two-step” computation flow (Figure 1)
$\rightarrow$ Two limitations
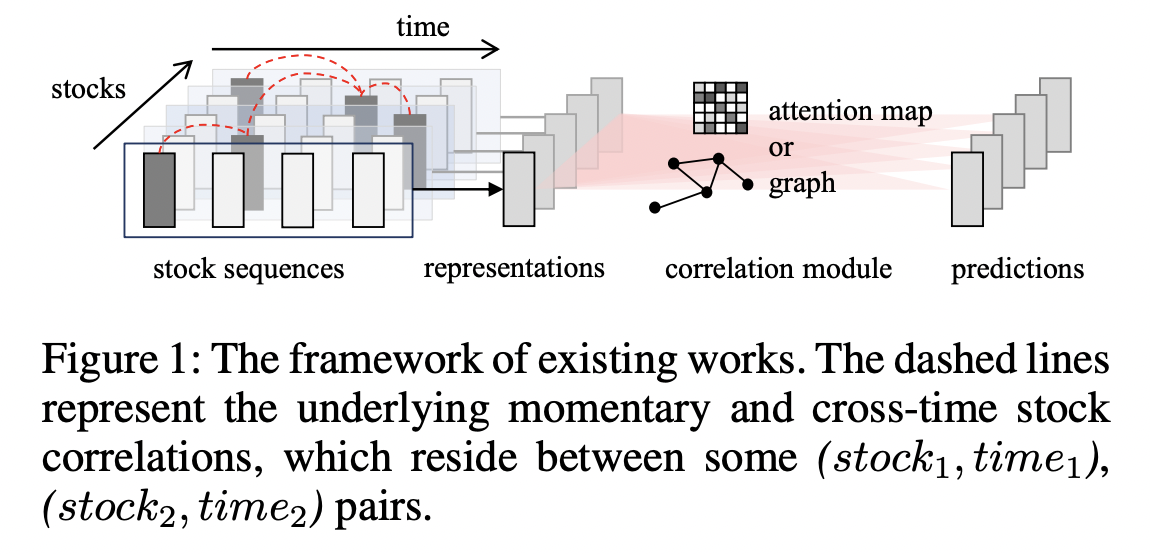
Two limitations of [Line 2]
- (1) “Distill” an overall stock representation & “Blur” the time-specific details of stock sequence
- (2) Ignore the impact of “varying market status”
Limitation (1)
Distill an overall stock representation & Blur the time-specific details of stock sequence
- a) Leading to weakness in modeling the de-facto stock correlations
- which often occurs momentarily and in a cross-time manner
-
b) Stock correlation is highly dynamic
- $\because$ Dominating factors of stock prices constantly change & may react to the same factors with different delays.
Naive solution?
-
Gather the $\tau \times \mathcal{S} $ feature vectors for “pair-wise” attention computation - $\tau$ is the lookback window length
- $\mathcal{S}$ is the stock set
$\rightarrow$ Limitation: Increased computational complexity
- Proposal: “Novel stock transformer architecture”
- Specifically designed for stock price forecasting
-
$\tau \times \mathcal{S} $ attention field (X) - Clustering-based approximation methods (X)
-
- How? Aggregates information from different time steps and different stocks alternately!
- Specifically designed for stock price forecasting
Limitation (2)
Ignore the impact of varying market status
- Features come into effect and expire dynamically!
- Has an influence on both the intra-stock sequential pattern & stock correlation
- Proposal
- To save the human efforts…
- Stock transformer with a “novel gating mechanism”
- Incorporates the market information to perform automatic feature selection
MASTER (MArket-Guided Stock TransformER)
Overcome both Limitation (1) & (2)
Contributions
- Novel stock transformer
- To effectively capture the stock correlation
- First to mine the momentary & cross-time stock correlation with learning-based methods
- Novel gating mechanism
- Integrates market information to automatically select relevant features
- Various experiments
2. Methodology
(1) Problem Formulation
Notation
- Each stock: $u \in \mathcal{S}$
- Feature vector of stock $u$: $x_{u, t} \in \mathbf{R}^F$.
- Collected at every time step $t \in[1, \tau]$
Task
- Focus on the prediction of the “change in stock price” rather than the “absolute value”
Return ratio
- Relative “close price” change in $d$ days
- $\tilde{r}u=\left(c{u, \tau+d}-\right.$ $\left.c_{u, \tau+1}\right) / c_{u, \tau+1}$,
- $c_{u, t}$: Closing price of stock $u$ at time step $t$
- $d$: Predetermined prediction interval
- Normalizes the market price variety between different stocks in comparison to the absolute price change
Goal of stock investment
= Rank & select the most profitable stocks
$\rightarrow$ Perform daily Z-score normalization of return ratio to encode the label with the rankings
- $r_u=\operatorname{Norm}_{\mathcal{S}}\left(\tilde{r}_u\right)$, as in previous work
a) Stock Price Forecasting
- [Input] Stock features $\left{x_{u, t}\right}_{u \in \mathcal{S}, t \in[1, \tau]}$
- [Output] Jointly predict the future (normalized) return ratio $\left{r_u\right}_{u \in \mathcal{S}}$.
(2) Overview
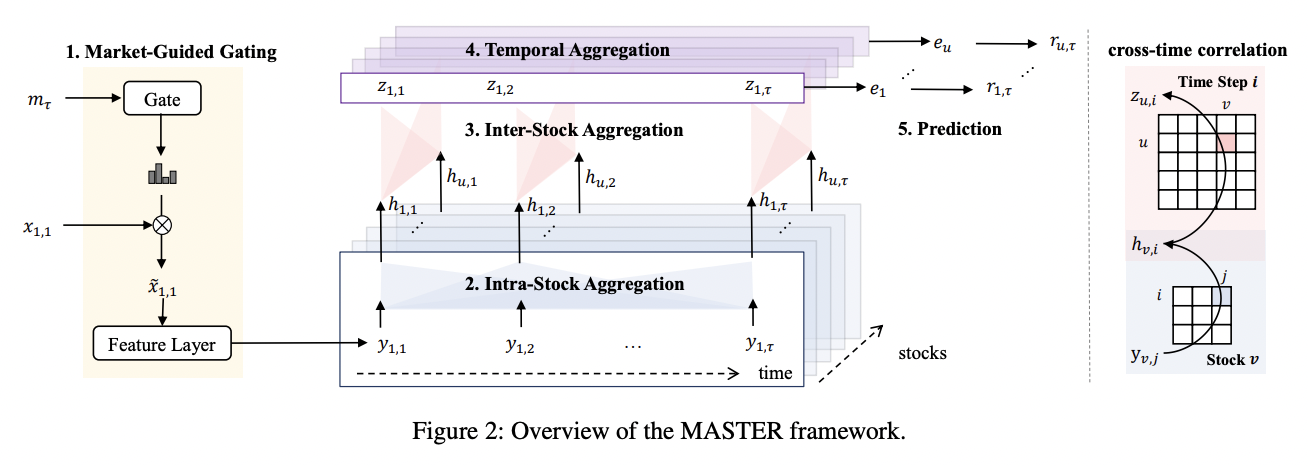
Consists of five steps
- (1) Market-Guided Gating
- (2) Intra-Stock Aggregation
- (3) Inter-Stock Aggregation
- (4) Temporal Aggregation
- (5) Prediction
(1) Market-Guided Gating
-
Goal: Construct a vector representing the current “market status” $m_\tau$
-
Act as a “rescaler”
- To rescale (stock) feature vectors by a gating mechanism
$\rightarrow$ Achieve market-guided feature selection!
(2) Intra-Stock Aggregation (within stock)
-
Goal: For each stock, aggregate information from “other time steps”
-
Output: Local embedding ($h_{u, t}$)
- Preserves the temporal local details of the stock
(3) Inter-Stock Aggregation (btw stock)
-
Goal: Compute “stock correlation” with attention
$\rightarrow$ Each stock aggregates the local embedding of “other stocks”
-
Output: Aggregated information ($z_{u, t}$ ) … called “Temporal embedding”
(4) Temporal Aggregation
- For each stock, the “last” temporal embedding queries from all historical temporal embedding
- Output: Comprehensive stock embedding $e_{\mathrm{u}}$.
(5) Prediction
- Input: Comprehensive stock embedding
- Output: Label prediction
(3) Market-Guided Gating
a) Market Status Representation
Current market status: Two aspects into a vector $m_{+}$
- (1) Market index “price”
- (2) Market index “trading volume”
(1) Market index price
- Weighted average of the prices of a group of stocks $\mathcal{S}^{\prime}$
- Weight = Share of market capitalization.
- $\mathcal{S}^{\prime}$ : Composed of top companies (with the most market capitalization)
- May differ from user-interested stocks!
- Include both (a) & (b)
- (a) Current market index price at $\tau$
- (b) Historical market index prices
- Mean & Std in the past $d^{\prime}$ days (to reveal the price fluctuations)
(2) Market index trading volume
- Reveals the investors involvement
- Mean & Std of market index trading volume in the past $d^{\prime}$ days, to reveal the actual size of the market.
- $S^{\prime}$ and $d^{\prime}$ are identical to the aforementioned definitions.
Definition) Market-Guided Stock Price Forecasting
Given $\left{x_{u, t}\right}{u \in \mathcal{S}, t \in[1, r]}$ and the constructed market status vector $m_r$, market-guided stock price forecasting is to jointly predict the future normalized return ratio $\left{r{\mathrm{u}}\right}_{\mathrm{w} \in S}$ -
b) Gating Mechanism
The gating mechanism generates one scaling coefficient for each feature dimension to enlarge or shrink the magnitude of the feature, thereby emphasizing or diminishing the amount of information from the feature flowing to the subsequent modules. The gating mechanism is learned by the model training, and the coefficient is optimized by how much the feature contributes to improve forecasting performance, thus reflect the feature effectiveness.
| Given the market status representation $m_\tau,\left | m_{\Gamma}\right | =F^{\prime}$, we first use a single linear layer to transform $m_{\Gamma}$ into the feature dimension $F=\left | x_{u, t}\right | $. Then, we perform Softmax along the feature dimension to obtain a distribution. |
where $W_\alpha, b_\alpha$ are learnable matrix and bias, $\beta$ is the temperature hyperparameter controlling the sharpness of the output distribution. Softmax compels a competition among features to distinguish the effective ones and ineffective ones. Here, a smaller temperature $\beta$ encourages the distribution to focus on certain dimension and the gating effect is stronger while a larger $\beta$ makes the distribution incline to even and the gating effect is weaker. Note that we enlarge the value at each dimension by $F$ times as the scaling coefficient. This operation