Enhancing Financial Time-Series Forecasting with Retrieval-Augmented Large Language Models
(https://arxiv.org/pdf/2502.05878)
Contents
- Introduction
- Traditional vs. LLM
- Limitation of RAG in Financial TS
- Proposal: RAG framework
- Dataset Construction
- Training Retriever
- Inference
- Other settings
- Contributions
- Problem Definition & Goals
- The RAG Framework
- Dataset Construction
- Sequence Serialization
- Retriever Training
- Inference
- Experiment
- Experimental Settings
- Main Results
Abstract
( Task: Stock movement prediction )
Traditional (text-trained or numeric similarity-based) retrieval methods:
\(\rightarrow\) Struggle to handle the intricacies of financial data!
Solution: Propose “RAG” framework for financial TS forecasting
Three key innovations
- (1) Fine-tuned 1B StockLLM
- (2) Novel candidate selection
- Enhanced by LLM feedback
- (3) Training objective
- Maximizes the similarity between “queries” and “historically significant sequences”
Details
- Retriever: FinSeer
- Uncover meaningful patterns while effectively minimizing noise in complex financial datasets.
- New datasets
- Integrate “financial indicators” and historical stock prices.
- Experimental results
- Proposed RAG framework outperforms both the baseline StockLLM and random retrieval methods
1. Introduction
(1) Traditional vs. LLM
Stock movement prediction [29, 30, 32]
- Focuses on forecasting the “direction” of price changes
[a] Traditional methods
- Rely on analyzing sequences of stock prices & financial indicators to identify patterns
- Often failed to capture the “semantic connections” between these sequences
[b] LLM-based methods
-
Shifted focus to leveraging textual data (e.g., news and tweets)
-
Often use only the past several days’ closing prices as reference
( while overlooking the rich insights embedded in historical TS )
\(\rightarrow\) Need to effectively integrate financial TS data with LLMs
(2) Limitation of RAG in Financial TS
Proposal: Retrieval-based approach
- To efficiently sift through extensive TS data
- Extract meaningful information to enhance LLMs’ ability
Challenges of RAG methods in financial TS retrieval?
-
(1) Textual (O), TS (X)
-
Most embedding-based retrieval methods (retrievers): Trained on textual data
\(\rightarrow\) Struggle to process numeric TS data
-
-
(2) Distance-based retrieval methods
-
Focus on numeric similarities
\(\rightarrow\) Fail to capture deeper semantic relationships
-
\(\rightarrow\) Underscore the need for a more “tailored retrieval framework for financial TS”
(3) Proposal: RAG framework
RAG for stock movement prediction
- First dedicated retriever for financial TS forecasting
- Financial TimeSeries Retriever (“FinSeer”)
- (Previous RAG) Rely on pre-trained encoders or distance-based metrics
- (FinSeer) Train a dedicated retriever tailored for continuous and complex temporal sequences.
(4) Dataset Construction
Limitations of existing datasets
- Often contain only price data
New datasets
- Integrate “20 groups of financial indicators” with stock prices
- Provide critical insights into market behavior that stock prices alone cannot capture
- By selecting ….
- [Stock] High-trade-volume U.S. stocks
- [“Indicators”] Chosen through domain expert consultation and mutual information analysis
(5) Training Retriever
Novel retrieval mechanism with three key innovations
- (1) New backbone LLM: StockLLM
- (2) Novel method for selecting positive and negative candidates
- (3) New training objective
a) New backbone LLM: StockLLM
-
Fine-tune LLaMA3.2-1B Instruct
-
By using a smaller LLM ….
\(\rightarrow\) Ensuring performance improvements are attributable to FinSeer (rather than the LLM’s capacity)
b) Novel method for selecting positive and negative candidates
-
StockLLM identifies TS segments that enhance the generative process
-
“Feedbacks from StockLLM” are used to select …
- The most beneficial sequences as positive candidates
- The least beneficial sequences as negative candidates
\(\rightarrow\) Bridge the gap between the retriever & LLM
- Ensure that retrieved data aligns with the LLM’s forecasting priorities!
c) New training objective
-
Inspired by Zhang et al. [39]
-
Ensures the retriever distinguishing (a) from (b)
- (a) Positive candidates: Historically significant sequences
- (b) Negative candidates: Noisy sequences
by maximizing the similarity between the query and candidate sequences!
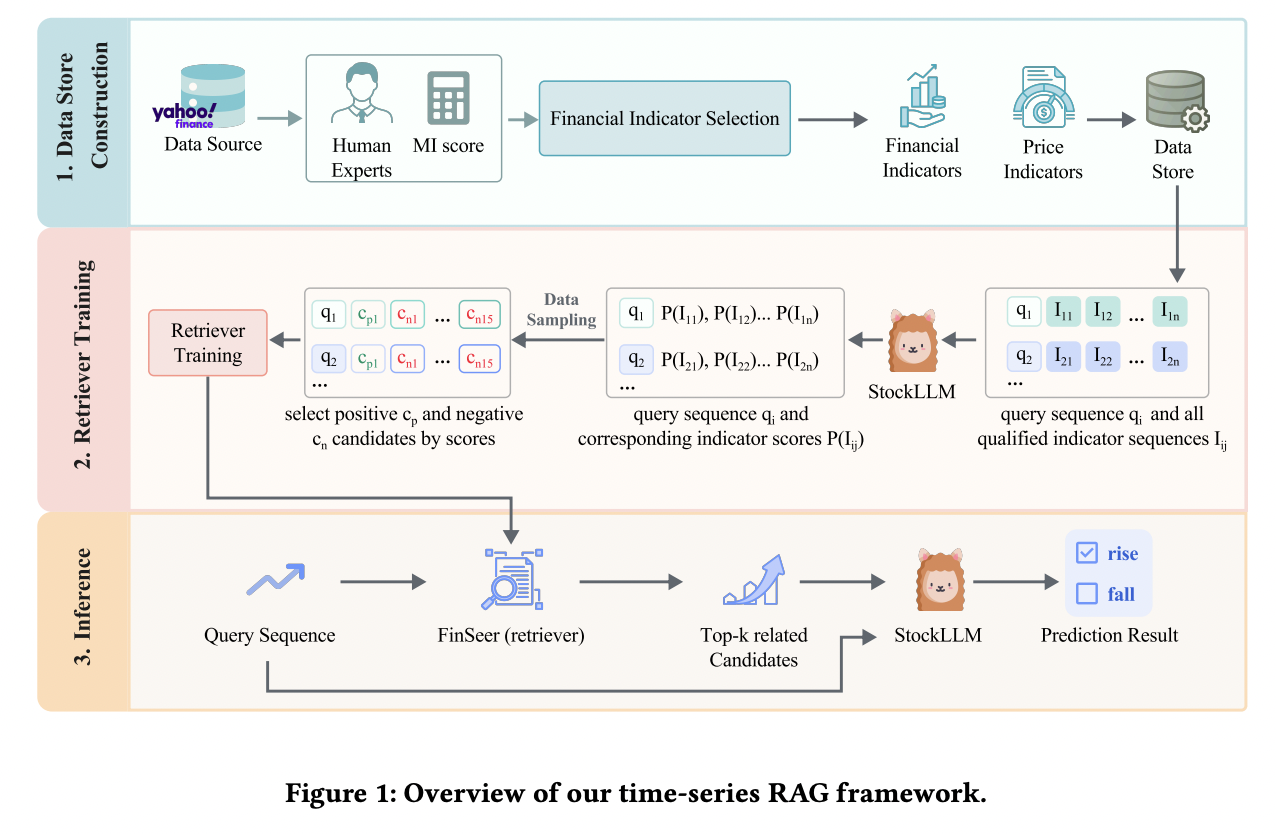
(6) Inference
Inference process of our RAG framework consists of three steps:
- Step 1) Retrieval
- Using FinSeer to retrieve relevant sequences from the candidate pool
- Step 2) Incorporation
- Incorporating these sequences into StockLLM’s input context
- Step 3) Combinination + Forecasting
- Combining this enriched context with the original query to perform forecasting
(7) Other settings
a) NO textual data
Solely rely on “temporal” information (w/o additional textual data)
\(\rightarrow\) To thoroughly evaluate the performance of our RAG framework and the retriever!
b) Experimental settings
- Backbone: StockLLM
- Retrieval methods
- Proposed RAG + Others (for comparison)
c) Findings
-
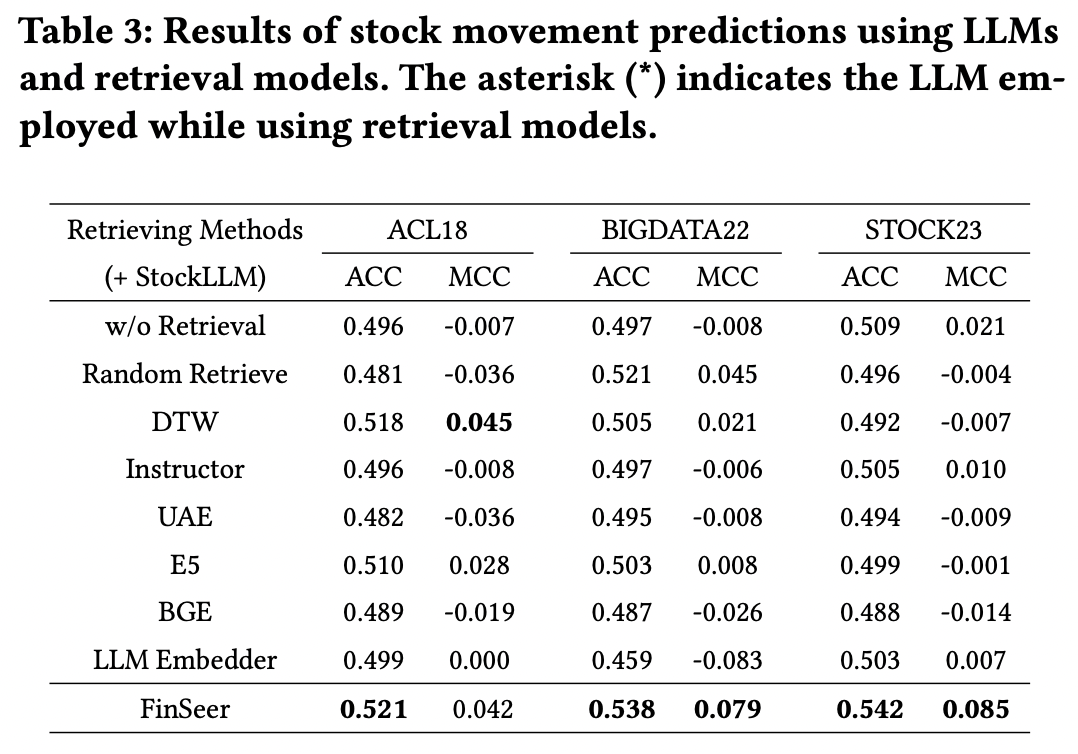
(1) RAG framework outperforms bare StockLLM!
\(\rightarrow\) Proposed RAG framework enhances LLM performance by incorporating relevant time-series data as financial context!
-
(2) RAG with retrieval models trained on text data does not always improve!
- Performance even declines in some cases
\(\rightarrow\) Highlights a fundamental gap between text-based retrieval and time-series data
- (3) RAG framework with FinSeer consistently surpasses all other retrieval models
- e.g., Instructor [22], BGE (BAAI General Embedding) [28], LLM-Embedder [39], UAE [14], and E5- mistral-7b-instruct [24]
(8) Contributions
- First RAG framework for financial TS forecasting
- Retrieval mechanism features 3 key innovations
- (1) Fine-tuned 1B parameter LLM (=StockLLM)
- (2) Novel candidate selection method leveraging LLM feedback to identify beneficial sequences
- (3) Training objective that maximizes similarity between queries and historically significant sequences
- Retrieval mechanism features 3 key innovations
-
New training and testing datasets
-
Stock price + “Financial indicators”
-
Indicators that signal upward or downward trends
( selected through domain expert consultation and mutual information analysis )
-
-
With new datasets, train the retriever!
-
- Propose a new retriever, FinSeer
- Specifically designed for TS forecasting
- Leverage LLM feedback & Prioritize historically significant sequences
- Experimental results
- Proposed RAG framework outperforms bare StockLLM and random retrieval!
2. Problem Definition & Goals
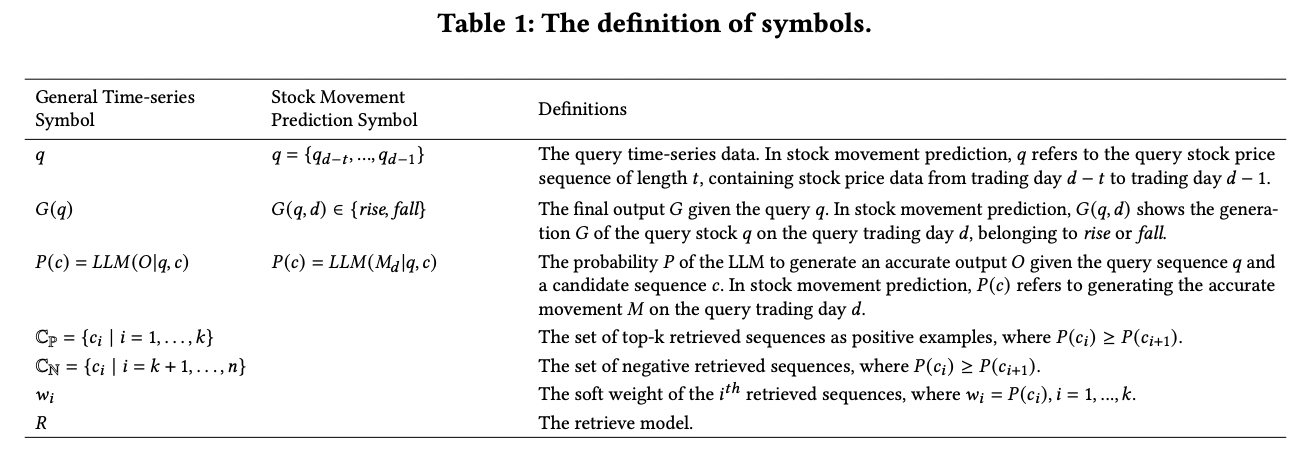
a) RAG framework
Retrieval-augmented financial TS forecasting
- [Output] Future values or trends \((G)\)
- [Input] Query sequence \((q)\) & Set of retrieved historical sequences \((c)\)
Goal of the retrieval model \((R)\) ?
\(\rightarrow\) Efficiently identify and extract the most useful historical sequences
b) Stock Movement Prediction Task
Binary classification task
- Predicting whether a stock’s price will rise or fall on the next trading day
Notation
- Query sequence \(q\)
- Represents the stock’s price over the previous \(t\) days
- Model
- Uses \(q\) to retrieve relevant sequences as context
- Predicts the stock’s movement \(M_{q, d}\) for the next trading day \(d\).
c) Rise/Fall Threshold Settings
Discretization: To classify daily movements as rise or fall …
\(\rightarrow\) Need to calculate the return \(R_t\),
Return \(R_t\)
- Represents the percentage change in the closing price
- \(R_t=\frac{\text { adj close }_d-\text { adj close }_{d-1}}{\operatorname{adj} \operatorname{close}_{d-1}} * 100\).
Previous works (Yoo et al. [37] and Soun et al. [21])
\(M_{q, d}= \begin{cases}\text { rise, } & R_t>0.55 \\ \text { fall, } & R_t<-0.5 \\ \text { freeze, } & -0.5 \leq R_t \leq 0.55\end{cases}\).
-
Follow these settings
( Do not evaluate freeze cases )
-
But still, include sequences with \(R_t \in[-0.5,0.55]\) as freeze candidates in the candidate pool!
d) Rationale for Unbalanced Threshold
To reflect the inherent dynamics of stock market behavior
- Stock prices typically rise gradually due to sustained investor optimism
- But fall sharply during panic selling or profit-taking
\(\rightarrow\) Aligns with market realities!
3. The RAG Framework
Proposals
-
(1) Novel RAG framework with new datasets
-
(2) Novel retrieval mechanism with a new backbone LLM
(a) Three datasets : financial indicators + (historical) stock prices
(b) StockLLM: A fine-tuned 1B parameter LLM,
- To ensure instruction-following capabilities
(c) Novel retrieval mechanism
- Leverages LLM feedback to select positive and negative candidates
- Employs a new training objective to prioritize historically significant sequences.
(1) Dataset Construction
-
Stock selection (feat. High-trade-volume U.S. stocks)
-
a) Price indicators
-
b) Financial indicators
Selected through domain expert consultation & mutual information analysis
Stock Selection
High-trade volume U.S. stocks across three periods:
- Period 1) 2014-2015
- Period 2) 2017-2018
- Period 3) 2022-2023.
Details
- Period 1&2) Align with two benchmark datasets
- Period 1) Same stocks as the ACL18 dataset
- Period 2) Same stocks as the BIGDATA22 dataset
- Period 3) STOCK23 dataset
- Manually select high-trade-volume stocks
a) (Basic) Price Indicators
Collected using the Yahoo Finance API
- opening price, highest price, lowest price, adjusted closing price, and trading volume
Train/Val/Test split
- Partition the dataset by stocks rather than by time
- Provides a more robust evaluation of the model’s ability to generalize to new stocks
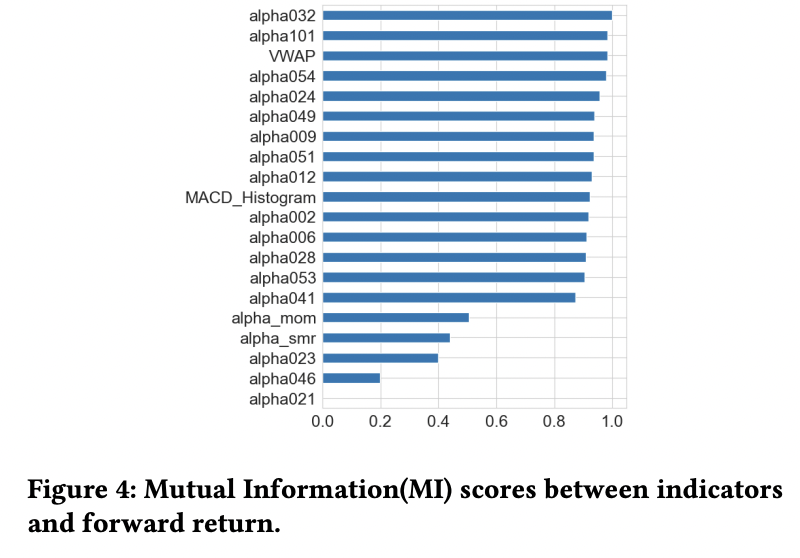
b) Financial Indicators
(Book) Machine learning for Trading
- Relationship between commonly used financial indicators and returns
MI between an indicator \(X\) and returns \(R_{\mathrm{r}}\) is calculated as
- \(I\left(X ; R_r\right)=f_r f_r p(x, r) \log \left(\frac{p(n, r)}{p(x) p r}\right) d x d r .\).
Procedure
- Step 1) Compute MI scores for each indicator
- Step 2) Select the top-20 indicator groups with the highest scores as our candidates
(2) Sequence Serialization
Stock movement prediction: depends on …
- (O) the changes in related features
- (X) Their exact values
\(\rightarrow\) Serialize stock prices and financial indicators into a time-series format
Use JSON format
\(\rightarrow\) Has been demonstrated to effectively support LLMs in interpreting TS data
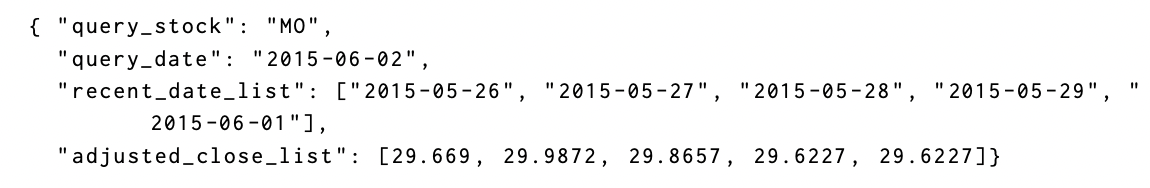
a) “Query” Sequence Serialization
Query date is at least one year after the start date of the corresponding split in the dataset.
\(\rightarrow\) Ensures that each query has enough candidate sequences for retrieval
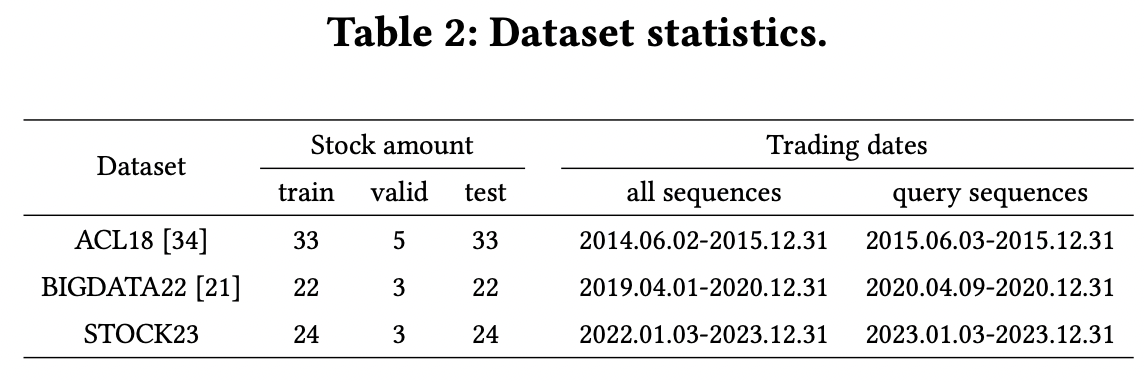
Example) ACL18 dataset
- Date: 2014-06-02 to 2015-12-31
- Query sequences: 2015-06-03 to 2015-12-31
- Each query sequence contains …
- (1) The adjusted close price from the previous five trading days
- (2) Basic stock information
- Indicator is represented as a five-day sequence
- One-day sliding window applied across trading days.
- Each query sequence contains …
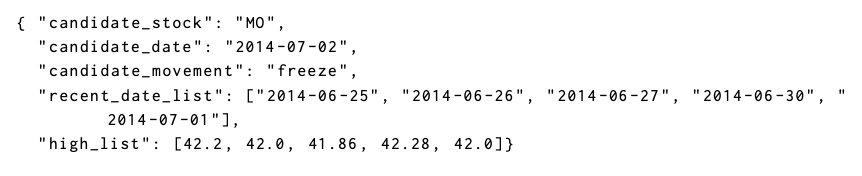
b) “Candidate” Sequence Serialization
Candidate pool dynamically incorporates sequences from the most recent trading days!
Example)
- Query date: 2015-06-03
- Candidate pool: 2014- 06-02 to 2015-06-02
For each candidate stock on a specific date, select ..
- (1) 6 Basic “price” indicators
- (2) 20 Groups of “financial” indicators
\(\rightarrow\) Both are represented as a five-day
Example) Indicator \(k\): highest price
(3) Retriever Training
Novel retrieval mechanism featuring three key innovations
- (1) StockLLM
- (2) Candidate selection method
- (3) Training objective
a) The LLM Backbone
StockLLM
-
Fine-tune LLaMA 3.2-1B-Instruct using LoRA
-
Intentionally using a smaller backbone model
\(\rightarrow\) Ensuring that performance improvements are attributable to FinSeer’s retrieval capabilities (rather than the LLM’s capacity)
-
Fine-tuning: LlamaFactory framework [40]
b) Candidate Scoring
Goal: Use LLM feedback to score each candidate
[Input] Integrate (1) & (2)
- (1) Query \(q\)
- (2) Candidate sequence \(c_i\) from the candidate pool
[Output] Logits
- Unnormalized scores
- Represent the model’s confidence for each possible class (e.g., “rise” or “fall”)
- Transformed into probabilities \(P(c)\) using the softmax function:
- \(P(c)=\frac{e^{z_c}}{\sum_j e^{z_j}}\).
- where \(z_c\) is the logit for the correct class & \(z_j\) represents the logits for all possible classes.
Summary: \(P(c)\) serves as the score for the candidate \(c_i\) w.r.t the query \(q\).
c) Candidate Selection
Based on their scores \(P(c)\).
- [P] Top-1 = Positive candidate (\(\mathbb{C}_P\))
- [N] Bottom-15 = Negative candidates (\(\mathbb{C}_N\))
d) Training Objective
Retriever \(R(q)\)
= Designed to intelligently distinguish between (1) & (2)
- (1. Pos) Historically significant sequences \(\mathbb{C}_P\)
- (2. Neg) Noisy sequences \(\mathbb{C}_{N}\)
Objective function
- Maximize a similarity measure \(\sup (q, s)\)
- \(R(q)=\arg \max _{s \in C_P \cup C_N} \sup (q, s)\).
e) Knowledge Distillation
Transfers knowledge from (a) \(\rightarrow\) (b)
- (a) Teacher model (LLM)
- (b) Student model (retriever)
Details: Minimize the KL divergence between (1) & (2)
- (1) Candidate distributions computed using the LLM’s rewards
- (2) Those predicted by the embedding model
Query \(q\) & Its candidate list \(\left\{\mathrm{C}_{\mathrm{P}}, \mathrm{C}_{\mathrm{N}}\right\}\)
\(\rightarrow\) LLM’s rewards for the candidates = \(\left\{P\left(c_i\right), i=1, \ldots, n\right\}\).
\(\rightarrow\) Normalize them: \(w_i=\operatorname{softmax}_R\left(\frac{P\left(c_i\right)}{\alpha}\right)\).
KL divergence:
\(\min \sum_c-w_i \times \log \left(\frac{\exp \left(\left\langle\boldsymbol{e}_q, \boldsymbol{e}_{c_i}\right\rangle / \tau\right)}{\sum_{c^{\prime} \in \mathrm{C}} \exp \left(\left\langle\boldsymbol{e}_q, \boldsymbol{e}_{c^{\prime}}\right\rangle / \tau\right)}\right)\).
- where \(\boldsymbol{e}_q\) and \(\boldsymbol{e}_{c_i}\) are the embeddings of the query \(q\) and candidate \(c_i\)
(4) Inference
Three key steps
-
Step 1) Retrieval
-
FinSeer retrieves relevant sequences from the candidate pool
( = Identify historically significant patterns )
-
-
Step 2) Incorporation
-
Retrieved sequences are incorporated into StockLLM’s input context
( = Enrich the model’s understanding of temporal dynamics )
-
-
Step 3) Combination + Forecasting
- Enriched context is combined with the original query to generate forecasts
4. Experiment
(1) Experimental Settings
a) Datasets
Test sets of the three datasets
- ACL18: 2,876 query sequences
- BIGDATA22: 2,868 queries
- STOCK23: 4,128 queries
For each query sequence, include all sequences containing financial indicators across all stocks in the test set (not limited to the same stock) as potential candidates
b) Baselines
Baselines
- (Bare) StockLLM
- Random retrieval
To evaluate our retriever FinSeer…
\(\rightarrow\) Five competitive RAG models!
c) Evaluation Metrics
- Accuracy (ACC)
- Matthews Correlation Coefficient (MCC)
(2) Main Results
Analyze our framework & retriever separately to evaluate their contributions.