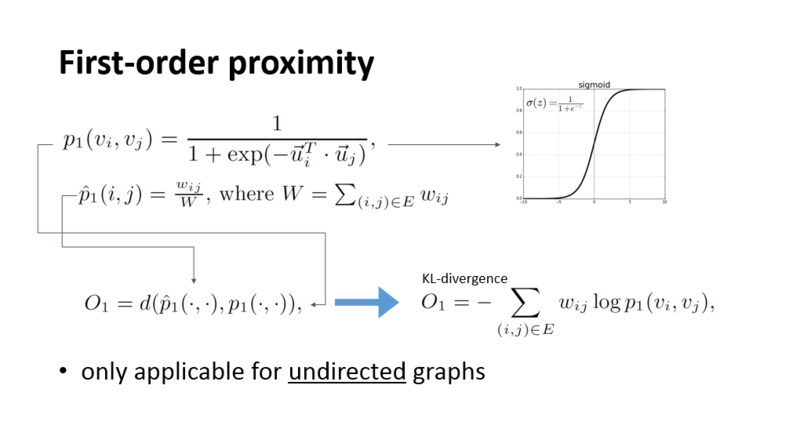
LINE implementation with Negative Sampling (1st order proximity)
- 1st order proximity를 이용해서 LINE을 구현해볼 것이다.
1. Import Dataset & Libraries
import networkx as nx
import matplotlib.pyplot as plt
import numpy as np
import random
import pandas as pd
from random import shuffle
from copy import copy

%matplotlib inline
edge = pd.read_csv('karate_club.edgelist', sep=' ', names=['x','y','w'])
graph = nx.Graph()
for i in range(edge.shape[0]):
    graph.add_node(node_for_adding = edge['x'][i])
    graph.add_node(node_for_adding = edge['y'][i])
    graph.add_edge(edge['x'][i], edge['y'][i])
1) adjacent matrix & one-hot encoded matrix
A = nx.to_numpy_matrix(graph, nodelist=sorted(graph.nodes()))
OH = np.identity(A.shape[0])
OH = np.identity(A.shape[0])
2) edges
- only needed in case of “different weights among edges”
edges = edge[['x','y']]
edges['w'] = 1
edges = np.array(edges)
2. Define Functions
1) first_prox
- 2개 node의 vector를 input하면 first-order proximity 계산
def first_prox(node_vec1,node_vec2):
    mul = np.dot(node_vec1.T,node_vec2)
    return 1/(1+np.exp(-mul))
3. First-order Proximity with Negative Sampling
def FirstOrder_neg_sampling(num_neg,epoch,lr):
    low_dim = np.random.rand(OH.shape[0],2)

    for _ in range(epoch):
        embed_vec =np.matmul(OH,low_dim)

        for node in range(embed_vec.shape[0]):
            ######################### find Neighbours & Non-Neighbours ##########################

            neighbours_index = np.nonzero(A[node])[1]
            not_neighbours_index = np.setdiff1d(np.arange(embed_vec.shape[0]), np.nonzero(A[node])[1])
            sampled_not_neighbours_index = np.random.choice(not_neighbours_index,num_neg)

            ########## find vectors of (1) main node, (2) neighbours, (3) non-neighbours ##########

            node_vec = embed_vec[node]

            for positive in neighbours_index:
                pos_vec = embed_vec[positive]
                neg_vecs = embed_vec[sampled_not_neighbours_index]

            ############################# UPDATE ###############################################
                embed_vec[node] -= lr*(first_prox(node_vec,pos_vec)-1)*pos_vec

                for neg_vec in neg_vecs:
                    embed_vec[node] -= lr*(first_prox(node_vec,neg_vec))*neg_vec

    return embed_vec
Emb = FirstOrder_neg_sampling(num_neg=10,epoch=100,lr=0.1)
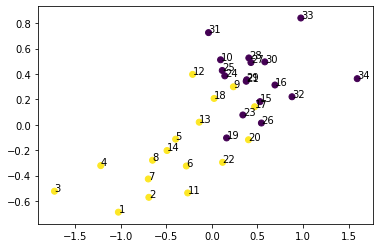
4. Visualization
Emb_df = pd.DataFrame({'X':Emb[:,0], 'Y':Emb[:,1],'Label':range(1,35)})

blue = [1,2,3,4,5,6,7,8,9,11,12,13,14,17,18,20,22]
red = list(set(range(0,35))-set(blue))

Emb_df.loc[Emb_df.Label.isin(blue),'Color']=1
Emb_df.loc[Emb_df.Label.isin(red),'Color']=0
plt.scatter(Emb_df['X'], Emb_df['Y'], c=Emb_df['Color'])

for i,txt in enumerate(Emb_df['Label']):
    plt.annotate(txt, (Emb_df['X'][i], Emb_df['Y'][i]))