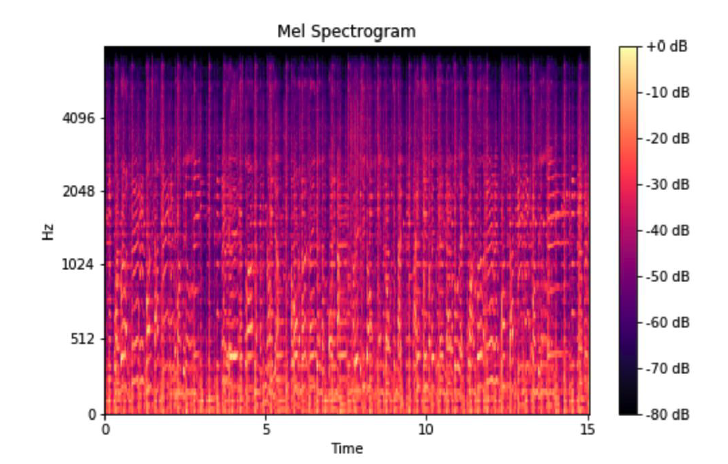
Melspectogram
참고 : https://www.youtube.com/watch?v=fMqL5vckiU0&list=PL-wATfeyAMNrtbkCNsLcpoAyBBRJZVlnf
1. Pyschoacoustic expriment
Pair 1
- a) 64Hz
- b) 262Hz
Pair 2
- a) 1568 Hz
- b) 1760 Hz
Even though both pairs have about 200 Hz difference..
\(\rightarrow\) If we listen to them … Diff( 1(a) , 1(b) ) » Pair ( 2(a), 2(b) )
\(\rightarrow\) Humans perceive frequency LOGARITHMICALLY
2. Ideal Audio Feature
(1) Time-frequency representation
(2) Perceptually-relevant amplitude representation
(3) Perceptually-relevant frequency representation
\(\rightarrow\) use Melspectograms
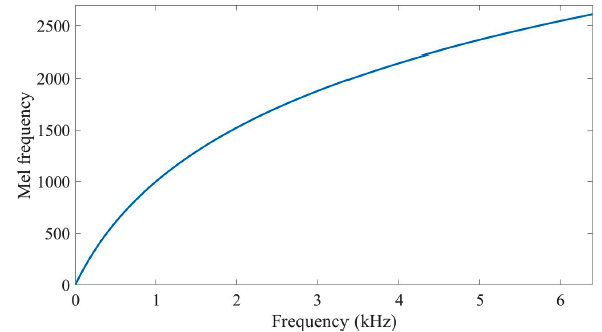
3. Mel-scale
Key Points
- Logarithmic scale of frequency
- Equal distances on the scale have same PERCEPTUAL distance
- 1000 Hz = 1000 Mel
(1) Frequency (Hz) \(\rightarrow\) Mel-Frequency
- \[m=2595 \cdot \log_{10} \left(1+\frac{f}{700}\right)\]
(2) Mel-Frequency \(\rightarrow\) Frequency (Hz)
- \(f=700\left(10^{m / 2595}-1\right)\).
4. How to get Melspectogram?
Step 1) Extract STFT
Step 2) Convert “amplitude” to “DBs”
Step 3) Convert “frequencies” to “Mel scale”
(1) Frequency \(\rightarrow\) Mel scale
Step 3-1) Choose the number of mel bands
- how many to choose? 40/60/90/128? … It depends on the problem!
Step 3-2) Construct mel filter banks
Step 3-3) Apply mel filter banks to spectogram
(2) Mel-filter banks
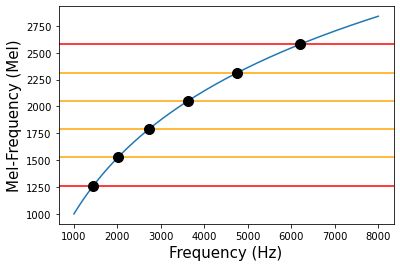
Step 3-2) Construct mel filter banks
- step a) convert LOWEST & HIGHEST frequency to Mel-frequency
- step b) create # of bands equally spaced points
- step c) convert back to Hz
- step d) round to nearest frequency bin
- step e) create triangular filters
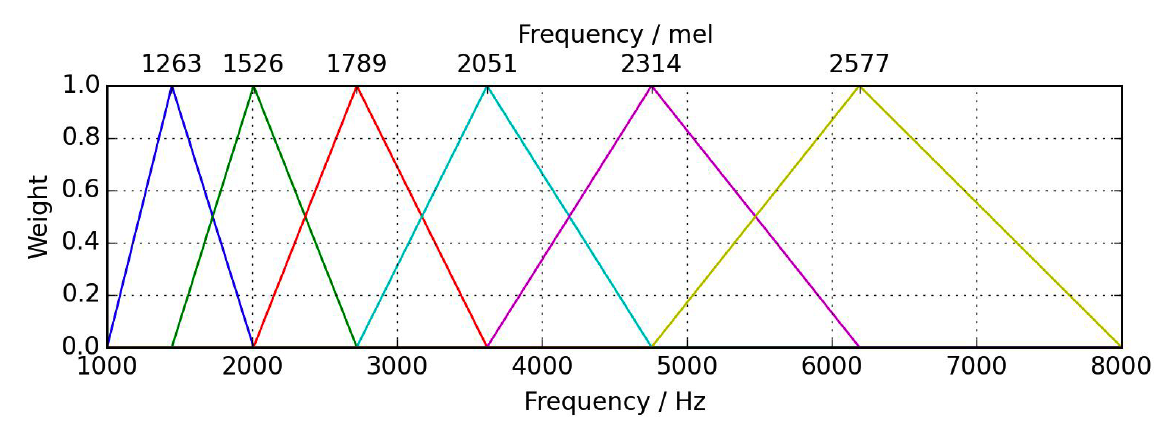
with Python
import numpy as np
import matplotlib.pyplot as plt

def Hz2Mel(f):
    mel = 2595*np.log10(1+(f/700))
    return mel

def Mel2Hz(mel):
    hz = 700*(10**(mel/2595)-1)
    return hz
num_bands = 6
equal_space_mel = np.linspace(min_mel,max_mel,num_bands)
equal_space_Hz = Mel2Hz(equal_space_mel)
plt.plot(x_Hz,y_mel)
plt.axhline(min_mel,color='red')
plt.axhline(max_mel,color='red')
for mel in equal_space_mel[1:-1]:
    plt.axhline(mel,color='orange')

for hz,mel in zip(equal_space_Hz,equal_space_mel):
    plt.plot(hz, mel, marker="o",markersize=10,color='black')
plt.xlabel("Frequency (Hz)",size=15)
plt.ylabel("Mel-Frequency (Mel)",size=15)
Applying Mel fitler bank \(M\) to spectogram \(Y\)
Melspectogram = \(MY\)
- Shape of \(M\) : ( # of bands, \(\frac{\text{frame size}}{2}\) + 1 )
- Shape of \(Y\) : ( \(\frac{\text{frame size}}{2}\) + 1 , # of frames )
\(\rightarrow\) Shape of \(MY\) : ( # of bands, # of frames )